
Aurora Borealis Notifications uses NOAA Space Weather for forecast information.
If you enjoy science and space weather, you will enjoy this website from NOAA. There are many different areas to explore. Most space weather websites and apps use NOAA Space Weather data.
⭐
The following introduction to Space Weather Forecasting will get you started. You will never have to ask what the forecast is doing, ever again. When someone asks you, you can go down this list and read the data with confidence to answer their question “Will the aurora be out tonight and when?”. This was written to provide you a very basic understanding of what we need to do to see the aurora. This was © written by Amy Stratman at Aurora Borealis Notifications. Please respect the time taken writing this and do not copy this without written permission.
How to read the forecast and current data:
Look up the forecast at NOAA Space Weather. The forecast will show the estimated Kp levels for the next 3 days. We follow the 3 day forecast because it takes up to 3 days for any solar event to reach the earth.
Note: The 27 day Outlook is not a forecast we follow because the forecast changes daily. If you use the 27 day Outlook to plan your vacation, you may or may not see the aurora based on the old numbers as the Kp levels are not an indicator of aurora sightings, and the coronal hole high speed stream may or may not arrive on time.

The description of Kp levels you may see on space weather forecasting websites or news reports are shown in this photo. The Kp levels are the physical measure, the G level storm descriptions are called the NOAA Space Weather Scales.
On the forecast, read the line that says “NOAA Geomagnetic Activity Probabilities”. Those are percentage estimates of what the Kp level may be on those days. Example indicates that on the first night, there is a 10% chance of active, which is Kp 4, and the next night there is a 35% chance. On the 3rd night in this example it is 20% chance.
The next line shows minor storm, which is G1 or Kp 5. On the first night, there is a 35% chance of Kp 5. Continuing, we have Moderate storm, which is G2 or Kp 6. Strong-Extreme storm is G3, G4, and G5 or Kp 7, 8, and 9.
“Active”, which is Kp 4, does not mean that there will be “actively dancing” auroras. It simply means conditions are Kp 4.

The dates and times on the forecast are in Coordinated Universal Time (UTC).
What is Kp? What is Kp level?
The Kp is the 3 hour average of the highest K-index from a collection of magnetometers around the world and at different latitudes. The Kp level forecast is what the space weather forecasters think will happen from any solar event reaching earth.
The Kp levels posted in this forecast are global levels, or what is called the planetary Kp index. You may on occasion see someone mention local Kp level. That is also accurate to use and quote, but overall, we watch the planetary (global) Kp index.
⭐
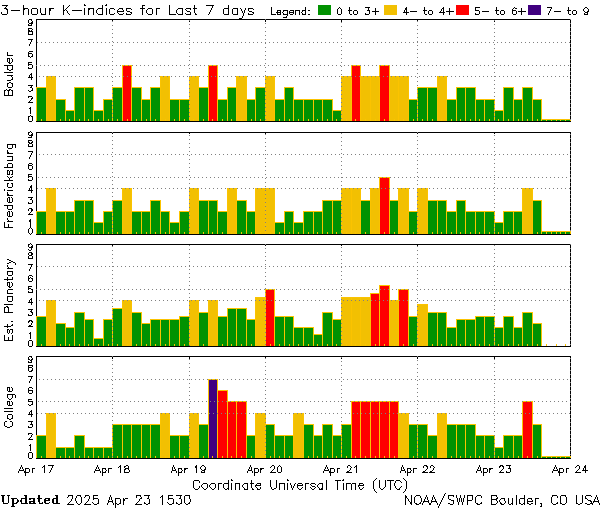
The current Kp level is indicated on this graph. Remember Kp levels are indicative of the PAST 3 hours of data using measurements from ground-based magnetometers around the world. Kp levels are not aurora sightings or proof of aurora. Kp 0 does NOT mean no aurora. Kp levels ARE a measurement of geomagnetic activity, and the higher the number, the bigger the area away from the magnetic poles the aurora may be seen.

⭐
Magnetometers can be watched for a kind of a head’s up to the current or tonight’s potential aurora. A magnetometer is a device that measures magnetic field or magnetic dipole moment. Some magnetometers measure the direction, strength, or relative change of a magnetic field at a particular location. If the data seems good, but you aren’t sure if you should head out, check the movement on the Geophysical Institute Alaska magnetometers or the Boulder Magnetometer.

What Kp level do you need for your area? See maps below.
For Fairbanks, Alaska, you need Kp 0. Therefore, ignore the low Kp level fluctuations unless there is a geomagnetic storm coming. Then, you will know that there may be a big event that you cannot miss, and you can tell your friends, especially those further south.
You may see a couple of different maps on various websites showing what Kp level you need in your area.
For example, if you are in North Dakota, you may see on the map you need Kp 5. Another map shows Kp 3. Usually you will need Kp 5. However, the Kp level can be lower if the solar winds are very high, and or if the Bz has a high negative number. Therefore, watch for the Kp level one lower than what you need, and watch the solar wind speeds. For a typical aurora night with average solar winds, watch for a higher Kp level if you are looking for auroras.
Here is the Kp level map from NOAA Space Weather. Please note that the lines are not exact, but gives you a general idea.
North America
Europe and Russia
Australia and Antarctica
South America and Antarctica
Another example is Anchorage, Alaska. Typically, you will need a Kp 4. However, you can see aurora at Kp 1 if the solar winds are favorable. If you are a serious aurora watcher, look at the forecast every night, and watch the solar winds. To see the aurora overhead from Anchorage, you will usually need a higher Kp level but it is completely possible at Kp 1 with high solar winds and a negative Bz.


Ovation “30 Minute Forecast”
Use this graphic to see what the aurora may do if the data remains steady, or what is happening based on the current data. Ovation stands for “Oval Variation, Assessment, Tracking, Intensity, and Online Nowcasting”.
This is NOT a live picture of the aurora!!! Green does not mean aurora, but it means a percentage of the chance of aurora. What we want to see is red, which indicates 90% or higher chance of seeing aurora.
Look at the HPI which is the hemispherical power input, or hemispheric power. We want that number to be high. The HPI measures the auroral particle precipitation in the zone that the aurora oval is centered. Over 50 is good for example. Over 100 is great.
Check the time of the graph to be sure you are seeing the current graph as it’s been known to freeze up.
The solar terminator is the line where the sunlight and darkness come together upon nightfall and sunrise. At a glance, you can see what time it is and estimate when the aurora is expected based on the rotation of the earth.


WSA-ENLIL SOLAR WIND PREDICTION (CME arrival times)
Use this model to watch the animation of the CME project from the sun, blast into space, or toward earth. The sun is yellow dot in the middle. Earth is the green dot to the side. STEREO A & B are the dots above and below earth. Click through on the photo to see the animation, then you can see the estimated arrival time of the plasma (which in turn shows as auroras in earths magnetic field). When there is no CME, the model shows ambient solar wind outflow or a coronal hole high speed stream. This is the graph to use when we are expecting a big event!

Next up, we watch the solar wind speeds.
The higher the solar wind speeds, generally the better for aurora viewing.
A background or typical solar wind speed is 250-500 km/sec.
Coronal holes (CHHSS) may produce solar wind speeds from 500-800 km/sec.
Coronal Mass Ejections (CME) may produce much higher solar wind speeds.
Source: NASA CME SCORE Classification System


Real Time Solar Wind (RTSW) can be viewed here. This is the graph many aurora chasers check constantly. On the lower left of the graph you can change the time frame from hours to days to years.
The Forecast Discussion is a written version of what has happened. This is interesting to read when you want a synopsis of what happened the night before, or what happened to the mysterious big storm predicted but never panned out. The Forecast Discussion also describes in words the latest forecast in the last paragraph. This clarifies what is happening using words rather than numbers. Here is the link to the current Forecast Discussion (updates daily).
⭐
We need to have the interplanetary magnetic field (IMF) in alignment to see the aurora.
The Bt is the total strength of the IMF.
The Bz is a directional component of the IMF. We want the Bt to be high, and the Bz to be negative. A negative Bz can be referred to as southward. We want a negative or a southward Bz. This indicates that the particles are being pushed into earth’s magnetic field, and therefore producing aurora. There is an exception to this… if the aurora is very strong, and the Bz goes positive, the aurora will continue being seen, but may wane a little. You can find information about the Bt and Bz on the same graph as the Real-Time solar wind (RTSW) or on the ACE RTSW MAG & SWEPAM. It is also referenced on the Space Weather enthusiasts dashboard at the top of the screen.

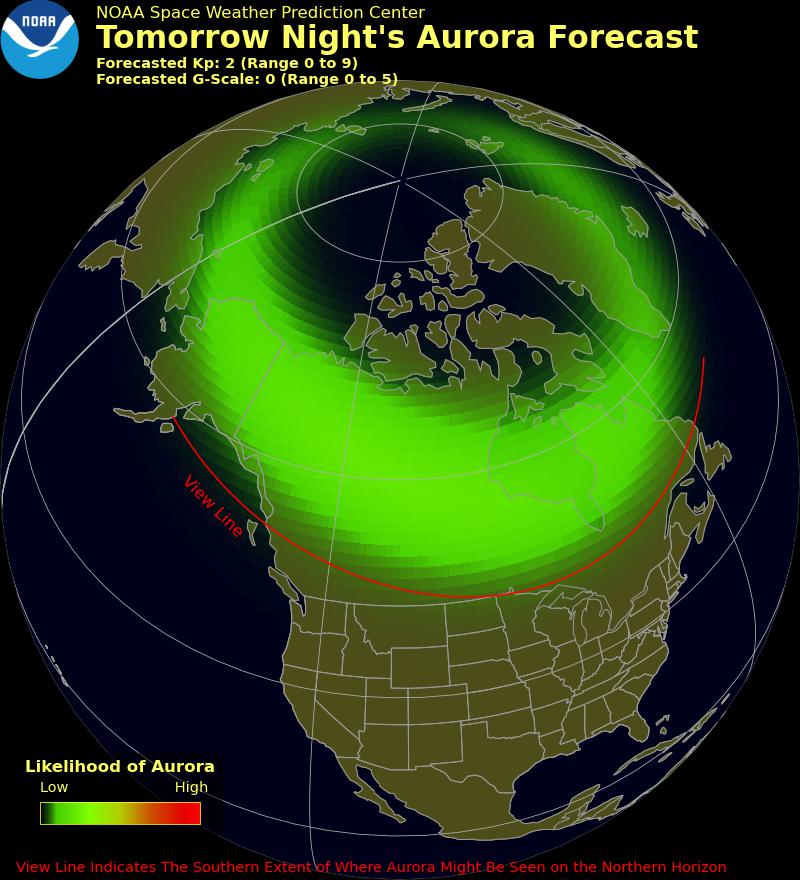
These experimental models for “Tonight’s Aurora Forecast” are modeled with the highest Kp index forecast for that night, between 6pm and 6am central time (in the USA). It does not mean the entire night is going to look like that. Remember, data changes by the minute. The viewline is an estimate based on the Kp level and not set in stone. Other factors such as the direction of the solar winds can change the viewline. It is not exact.
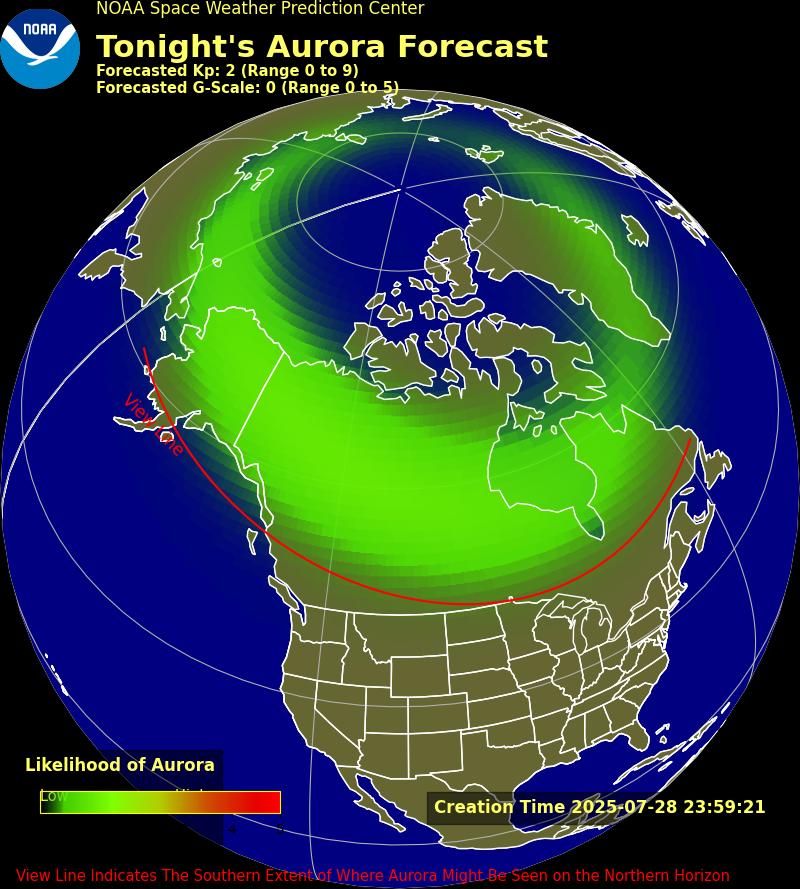 Green does not mean aurora, it means a likelihood of aurora. Red indicates a higher chance. See legend.
⭐
On a daily basis, we watch the data, so we can know if the aurora will be out, and if we should plan on seeing it or telling others if they can see it. When there is a coronal mass ejection (CME) that is geoeffective (headed toward earth), we can expect auroras at the time it hits our atmosphere. The timing of when it will hit depends on the speed of the solar winds. When the coronal hole high speed stream (CHHSS) is forecast, we can also anticipate potentially good aurora. When neither are forecast, we have typical background level data. Auroras may still be seen in the higher latitudes with typical or flat data.
⭐
You can get free email alerts of forecasts and storms by subscribing to NOAA Space Weather alerts.
No need to pay a service for something you can get FREE from NOAA Space Weather!!!
At the minimum, select WATCHES, WARNINGS, and ALERTS for higher level storms, as well as SUMMARY: Geomagnetic Sudden Impulse
⭐
To sum it up:
- Know the Kp level you need for your area.
- Follow the forecast daily. Watch for “CME” and or “CHHSS” which indicates possible storm level auroras.
- Look at the solar wind speeds (higher the better).
- Look at the Bt and Bz (need Bz to be negative).
- Watch Ovation 30-min forecast to get a visual on the data.
- Check magnetometers for any movement.
- Also do the obvious— Look outside to the north with your own eyes, and check all aurora webcams.
Learn about solar flares for a little more advanced aurora watching!
To further your knowledge on space weather, forecasting, and how to view the aurora using this information, here are some keyword search word suggestions for learning:
Sunspots
Solar flares and their classes
Coronal Mass Ejections (CME)
Coronal Holes (CHHSS)
Space weather satellites / spacecraft DISCOVR, ACE, STEREO A & B, GOES
SOHO, SDO
heliophysics
astrophysics
geospace
aeronomy
solar-terrestrial physics
Very informative! Thank you for this, it’s awesome!